Premiums, Discounts, & Z-Scores
Destra Capital
The information presented contains hypothetical situations, which may not be reflective of actual performance. Past performance is not a measure or guarantee of future results
Closed-End Funds differ from Open-End Funds in many ways. One key difference is through pricing mechanics and terminology, such as Premium/Discount and Z-Scores.
Premiums & Discounts
Unlike Open-End Funds which are bought and sold over-the-counter, exchange-traded Closed-End Funds (“CEF”) are listed on an exchange (such as the NYSE or NASDAQ) and therefore they have two prices: a NAV, like Open-End Funds, that values the assets less liabilities on a per share basis, and a Market Price at which the shares of the CEF trade in the secondary on the exchange. More often than not, these prices differ from one another creating a Premium or Discount of the Market Price relative to the NAV. There are many factors that cause this price dislocation. For more on this concept, see Factors that impact Closed-End Fund Market Prices later in this reading.
If a Closed-End Fund has a NAV of $20, but is trading at the Market Price of $19 then it is said this fund is trading at a 5% discount to NAV. Now, on the flip side, if the NAV is still $20 and the Market Price is $21 then this fund is trading at a 5% premium to NAV. In simpler terms, if the Market Price is below the NAV, it is trading at discount because one is buying at a price less than the fair value of the underlying assets. The opposite is true for a fund that has a Market Price higher than the NAV, that would be considered a premium.
A simple formula to calculate the Premium/Discount is below:
Premium/Discount = (Market Price – Net Asset Value) / Net Asset Value
Using our examples from above:
Example 1: Discount to NAV
Market Price = $19
Net Asset Value = $20
($19-$20) / $20 = -5% or a 5% Discount to NAV
Example 2: Premium to NAV
Market Price = $21
Net Asset Value = $20
($21-$20) / $20 = +5% or a 5% Premium to NAV
It is important to note that the current Premium/Discount is only one way to determine if a CEF might be undervalued or overvalued.
Z-Statistics (or “Z-Score”)
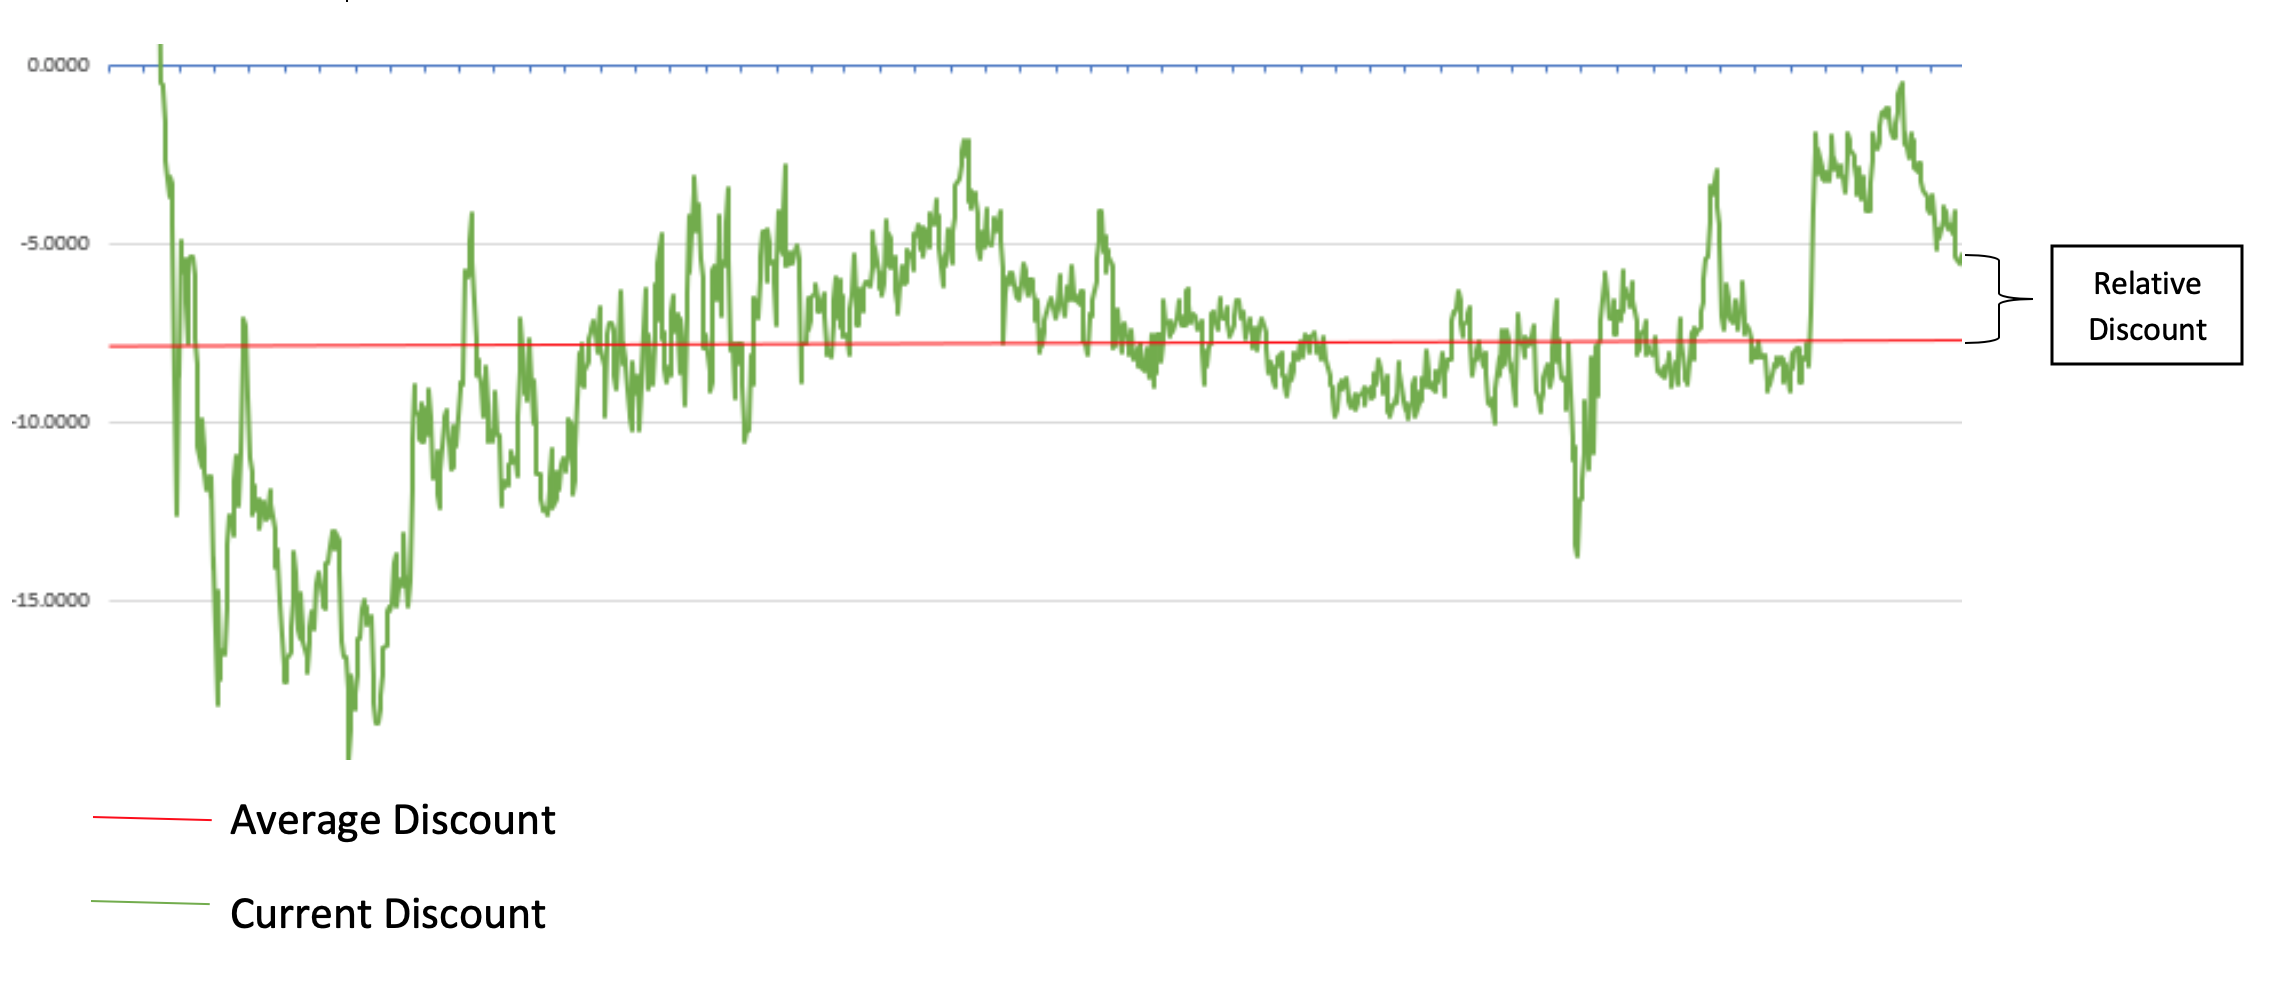
The current premium/discount only paints half of the picture and a “Z-score” can sometimes help provide the other half. Think in terms of “absolute” and “relative”. The current Premium/Discount is “absolute”, Z-Score is “relative”.
“Absolute” would be: “wow my portfolio returned 20% last year, I am happy.”
“Relative” would be: “I returned 20% last year, but the general market returned 30%. Maybe knowing this now, I am not as happy.” ☹
The Z-Score for Closed-End Funds is the current premium/discount compared to the historical average of the premium/discount. In other words, at this price, is the Fund historically overvalued or undervalued?
For example, a fund could be trading at 10% discount (Market Price below NAV). This may suggest that the CEF could be considered “cheap”; but that same CEF might historically trade at a 20% discount. With this in mind, you might wait to see if the fund reverts back to the mean allowing you to buy closer to or even lower than its historical average 20% discount.

Formula for Z-Score:

A few things to point out about this calculation:
- The Average Historical Discount time period can be whatever length you prefer to measure.
- As mentioned before, Closed-End Funds are generally mean-reverting, but that is not to say the discount might not have a widening or tightening trend over time
- Z-Score is a measure of comparing the discount to the Fund’s own historical discount, not a comparison of discount to other CEFs
Now, knowing how Z-Score is calculated and what it is used for, it is important to have some context as to what is an attractive Z-Score?
- A score of 0 would mean that the current discount is the same as the average discount.
- A negative Z-Score would demonstrate that the current discount is below the average discount, thus potentially displaying an undervalued Fund, relative to its historical average.
- A positive Z-Score is the reverse. It would demonstrate that the current discount is above the average discount, thus potentially displaying an overvalued Fund, again all compared to its historical premium/discount trading average.
FACTORS THAT IMPACT CLOSED-END FUND MARKET PRICES
There are many theories for why the phenomenon of Premium/Discount exists. Many of these factors are interrelated, and some factors have a larger impact than others. Some (but not all) of these factors include:
The Asset Class in which the fund invests
Has a specific asset class fallen in or out of favor in the current market environment?
Market volatility
Is the market more or less volatile than normal?
Recent NAV and Market Price performance
Has the Fund’s NAV performance underperformed or outperformed its peers?
Tenure of the Fund Managers
Has there been a personnel change? Does a firm have more or less experience?
Fund Manager Brand recognition
What is the reputation and track record of the Fund Manager?
Distribution policy adjustments
Was there a distribution increase or decrease announcement?
Tax dynamics
Does the asset class or investment strategy have positive or negative tax characteristics?
Interest rates
Are interest rates rising or falling in the economy?
As previously stated, this list is incomplete and there can be other significant factors that influence a CEF and how it trades in both an absolute and relative sense. All investing involves risk and the chance to lose some or all of your investment. Be prudent, investigate the investments you are considering carefully and seek out help from your financial advisor or investment professional before you invest.
